Compare
ReasonScape Compare Tools
The ReasonScape Compare tools create systematic 2D grid visualizations that enable multi-dimensional analysis of AI reasoning capabilities across models, tasks, and difficulty parameters. These tools transform the interactive exploration capabilities of the ReasonScape Explorer into comprehensive comparison matrices for research and evaluation.
Overview
ReasonScape provides two complementary comparison tools:
compare_surface.py: Creates grids of 3D difficulty manifold surfaces for cross-model performance comparisoncompare_project.py: Creates grids of token-frequency FFT analysis plots for cognitive architecture comparison
Both tools generate publication-ready PNG exports with embedded statistics and multi-line labeling for complex experimental conditions.
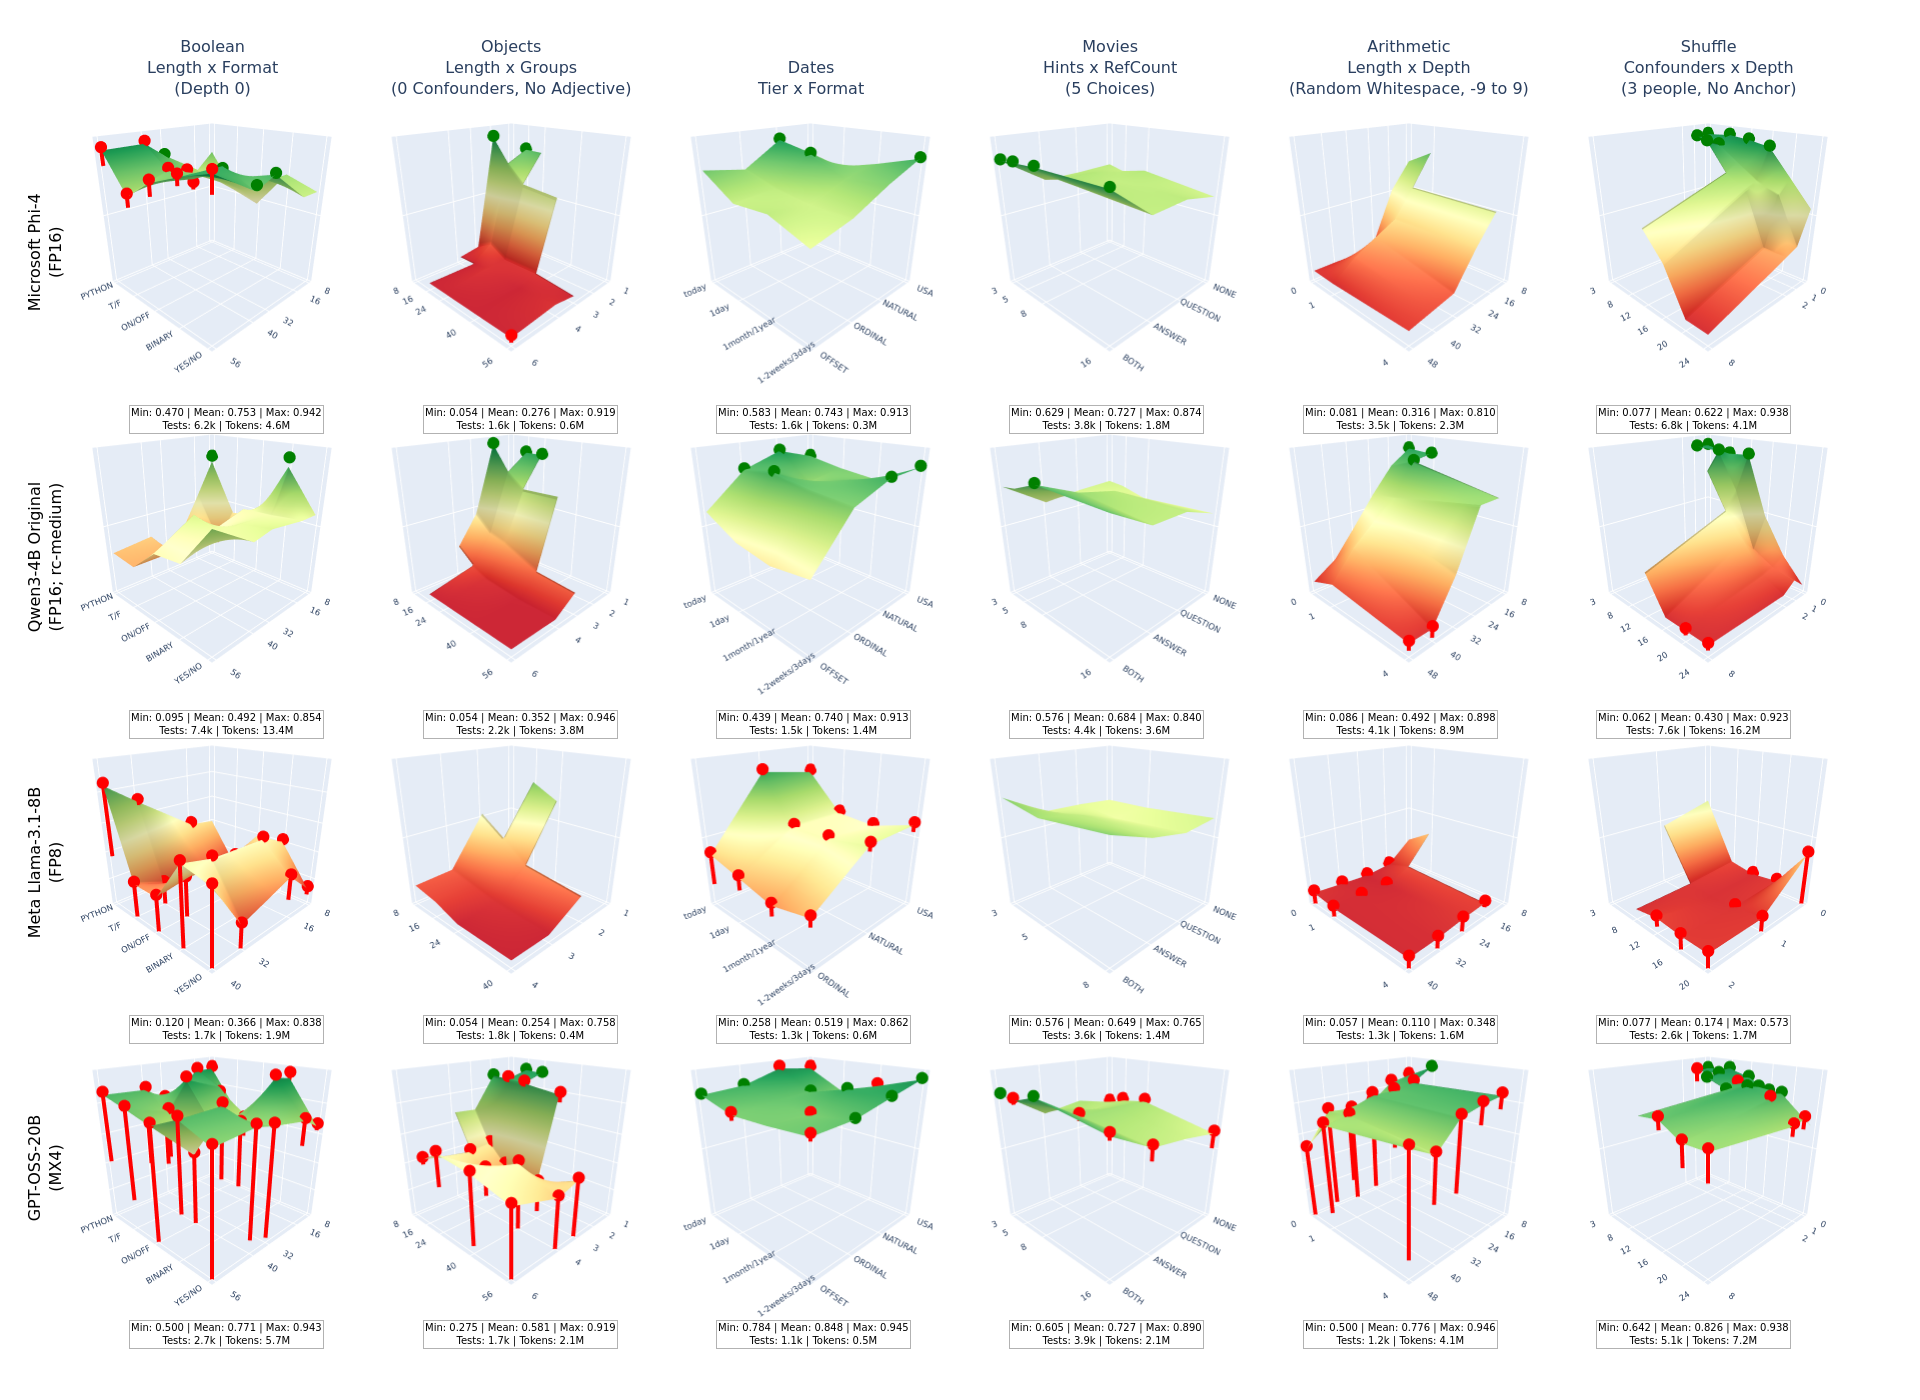
Surface Comparison Tool (compare_surface.py)
The Surface Comparison tool creates systematic grids of 3D difficulty manifold visualizations, enabling researchers to compare model performance across identical reasoning challenges.
Key Features
- Cross-Model Analysis: Compare multiple models on identical difficulty surfaces
- Multi-Task Support: Analyze single tasks (all surfaces) or all tasks (first surface each)
- Statistical Annotations: Embedded min/mean/max accuracy with test counts and token usage
- Group Filtering: Focus on specific model families or experimental conditions
- Consistent Scaling: Unified Z-axis (0-1 accuracy) and camera angles across all subplots
Usage
Basic Cross-Model Comparison
Compare all available models on the first surface of each task:
python compare_surface.py data/dataset-m6.json --output all_models_overview.png
Single Task Deep Dive
Analyze all surfaces of a specific task across models:
python compare_surface.py data/dataset-m6.json --task arithmetic --output arithmetic_deep_dive.png
All Surfaces Analysis
Generate comprehensive comparison of all surfaces from all tasks:
python compare_surface.py data/dataset-m6.json --task all --output comprehensive_analysis.png
Group-Filtered Analysis
Focus on specific model families using group filters:
python compare_surface.py data/dataset-m6.json --groups "opensource,meta" --output opensource_comparison.png
Command Line Arguments
config: Dataset configuration JSON file (required)--task: Task filter - specific task name, "all" for all surfaces, or omit for first surface per task--output: Output PNG filename (default:comparison.png)--groups: Comma-separated list of scenario groups to include
Grid Layout
The tool generates a grid where:
- Rows: Model scenarios (filtered by groups if specified)
- Columns: Task surfaces (determined by task parameter)
- Y-axis labels: Multi-line scenario names with automatic line breaking
- Column titles: Multi-line task/surface labels with parenthetical information
- Annotations: Statistical summaries below each subplot
Statistical Annotations
Each subplot includes embedded statistics:
Min: 0.234 | Mean: 0.567 | Max: 0.891
Tests: 12.3k | Tokens: 45.6M
- Accuracy Range: Minimum, mean, and maximum accuracy across the surface
- Test Volume: Total number of test cases (in thousands)
- Token Usage: Total tokens consumed (in millions)
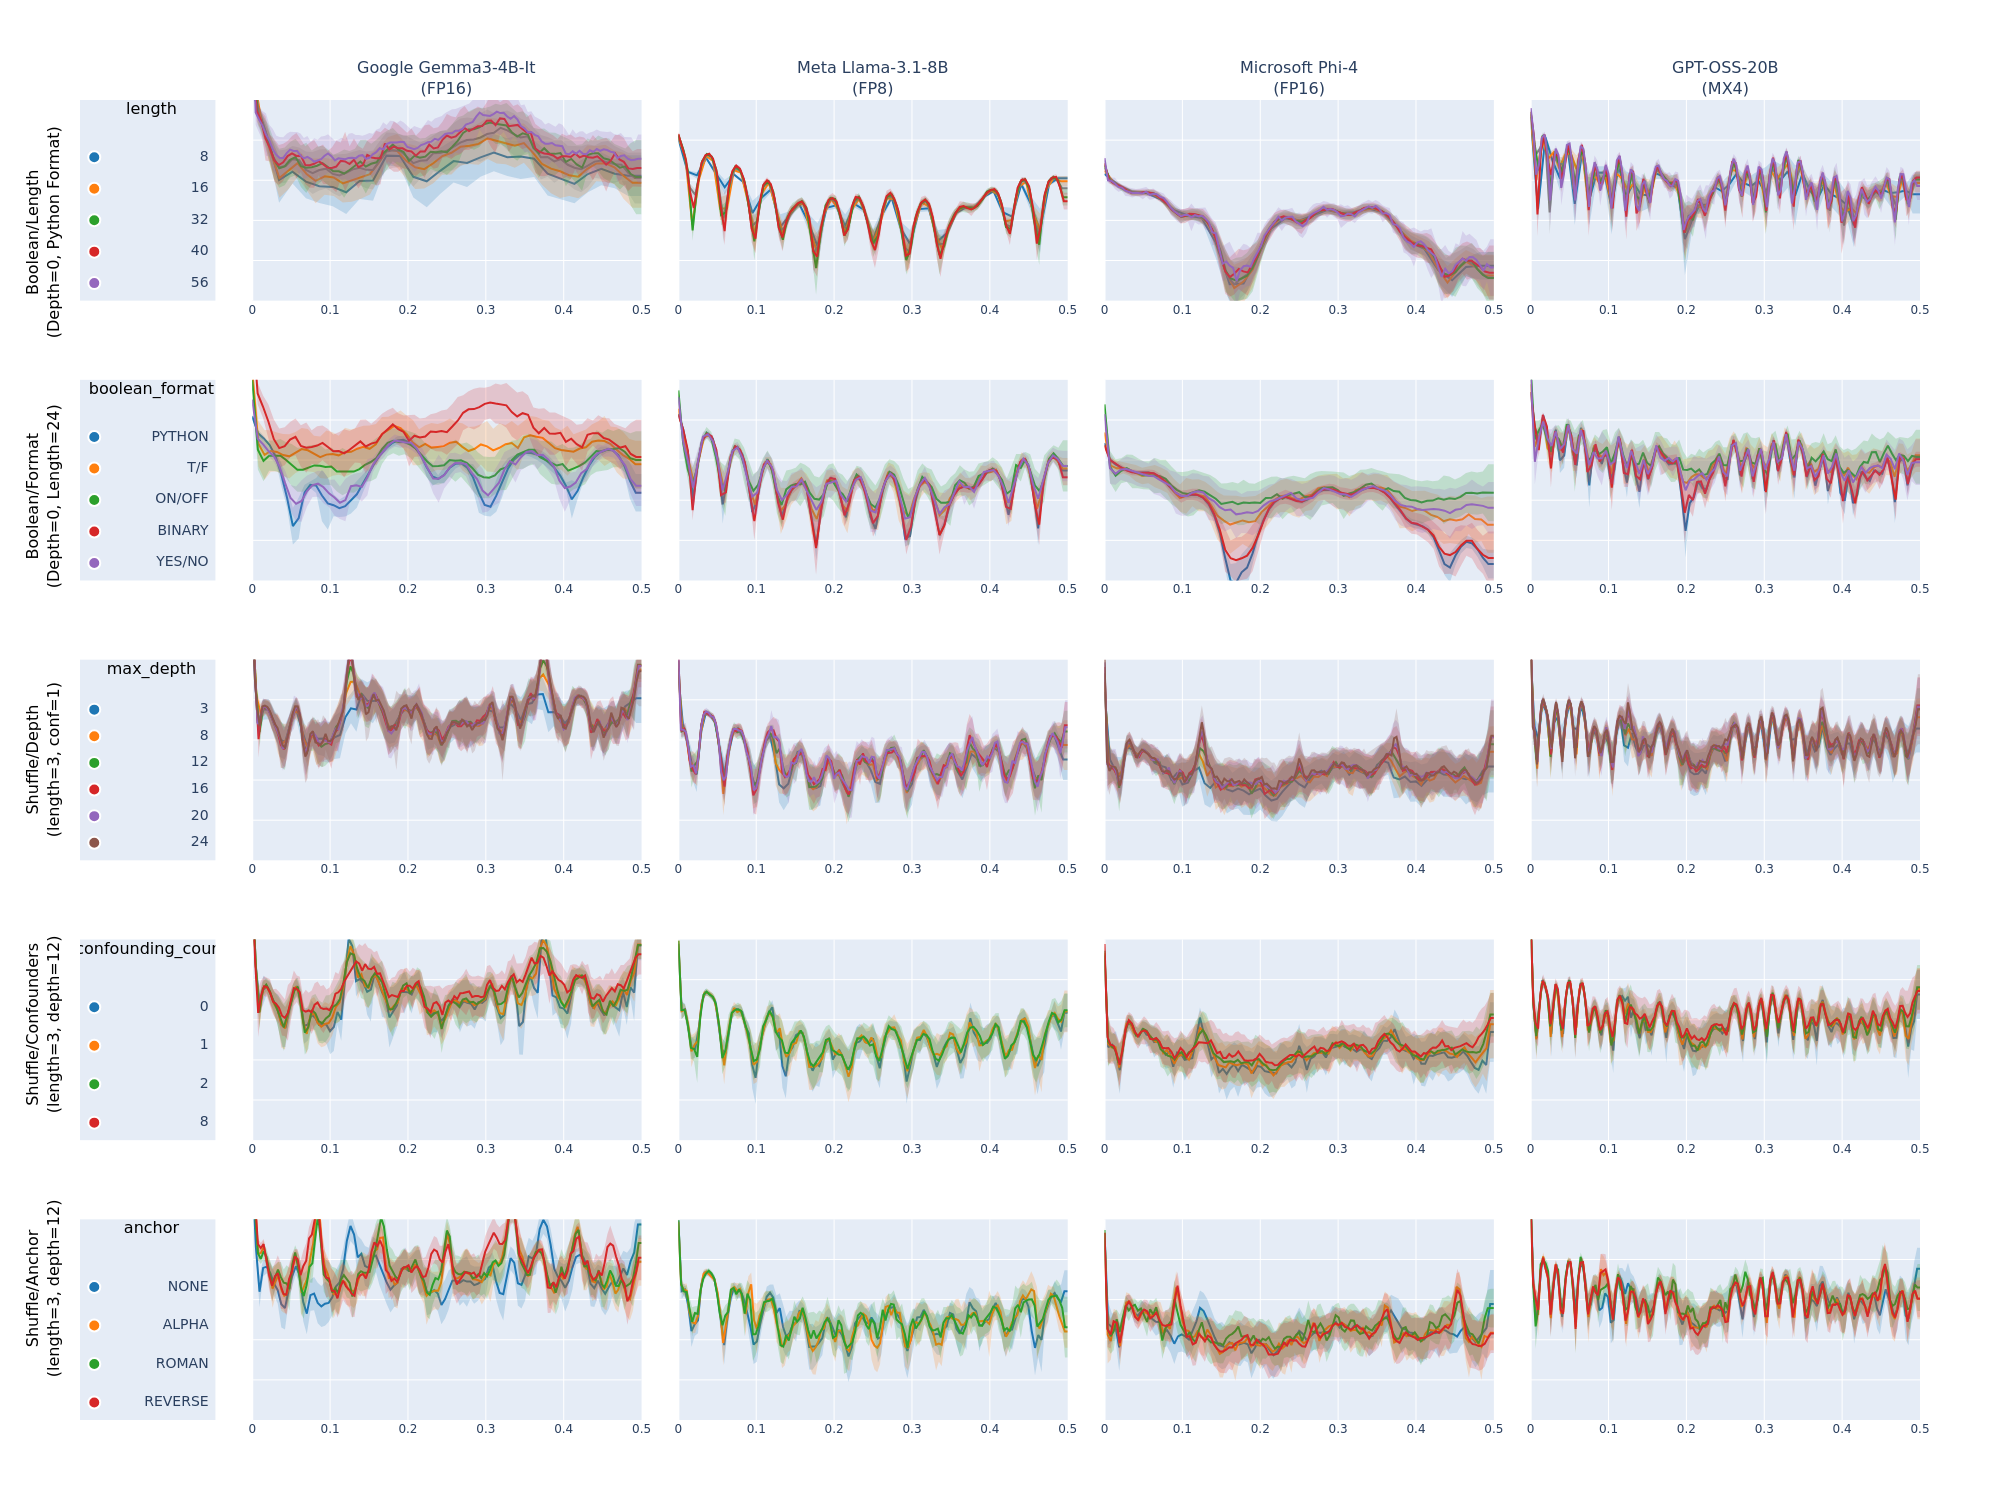
FFT Comparison Tool (compare_project.py)
The FFT Comparison tool creates systematic grids of token-frequency spectral analysis plots, revealing cognitive architecture patterns across models and reasoning tasks.
Key Features
- Spectral Analysis Grids: Compare token-frequency patterns across models and projections
- Consistent Color Mapping: Fixed color palette ensures parameter values have identical colors across all subplots
- Integrated Legends: Dedicated legend column with parameter value mappings
- Multi-Task Support: Analyze all projections from specified tasks or all tasks
- Statistical Confidence: Mean spectra with standard deviation bands
Usage
All Tasks FFT Analysis
Compare token-frequency patterns across all available projections:
python compare_project.py data/dataset-m6.json --output fft_all_tasks.png
Specific Task Focus
Analyze FFT patterns for specific tasks only:
python compare_project.py data/dataset-m6.json --task "arithmetic,boolean" --output fft_math_tasks.png
Group-Filtered FFT Analysis
Focus on specific model families:
python compare_project.py data/dataset-m6.json --groups "proprietary" --output fft_proprietary_models.png
Command Line Arguments
config: Dataset configuration JSON file (required)--task: Comma-separated list of tasks to include (default: all tasks)--output: Output PNG filename (default:fft_comparison.png)--groups: Comma-separated list of scenario groups to include
Grid Layout
The tool generates a grid where:
- Rows: Task projections (each projection becomes a row)
- Columns: Legend column + model scenarios
- Y-axis labels: Multi-line task/projection labels
- Column titles: Multi-line scenario names
- Legend column: Parameter value mappings with consistent colors
FFT Analysis Components
Each FFT subplot shows:
- Mean spectrum lines: Average token-frequency response for each parameter value
- Confidence bands: Standard deviation regions around mean spectra
- Consistent colors: Parameter values use identical colors across all models
- Frequency range: Typically 0-64 Hz covering linguistic complexity patterns
Color Consistency
The tool uses a fixed 10-color palette that cycles consistently:
- Same parameter values → Same colors across all models
- Legend integration → Clear parameter-to-color mapping
- Cross-model comparison → Visual patterns immediately apparent
Integration with Dataset Configuration
Both tools rely on dataset configuration files that define visualization parameters and data organization. For detailed information about the dataset configuration format, see the Configuration Documentation.
The key components include:
Surface Definitions (for compare_surface.py)
{
  "basetasks": {
    "arithmetic": {
      "surfaces": [
        {
          "label": "Length x Depth (Random Whitespace, -9 to 9)",
          "filter": {"min_number": -9, "max_number": 9, "prob_dewhitespace": 0.5},
          "x_data": "length", "x_values": [8, 16, 24, 32, 40, 48],
          "y_data": "max_depth", "y_values": [0, 1, 4]
        }
      ]
    }
  }
}
Projection Definitions (for compare_project.py)
{
  "basetasks": {
    "arithmetic": {
      "projections": [
        {
          "label": "Length (depth=0, whitespace=50%)",
          "axis": "length",
          "filter": {"max_depth": 0, "prob_dewhitespace": 0.5},
          "values": [8, 16, 32, 48],
          "labels": ["8","16","32","48"]
        }
      ]
    }
  }
}
Scenario and Group Management
{
  "scenarios": {
    "gpt-4o+zerocot-nosys+greedy-4k": {
      "label": "OpenAI GPT-4o",
      "groups": ["openai", "proprietary"]
    },
    "llama-3.1-8b+zerocot-nosys+greedy-4k": {
      "label": "Meta Llama-3.1-8B",
      "groups": ["meta", "opensource"]
    }
  }
}
Research Applications
Cross-Model Performance Analysis
Use compare_surface.py to:
- Identify model strengths: Which models excel at specific reasoning challenges?
- Find failure modes: Where do models consistently break down?
- Compare architectures: How do different model families handle complexity?
- Validate improvements: Do model updates improve performance across all difficulty dimensions?
Cognitive Architecture Investigation
Use compare_project.py to:
- Detect processing patterns: How do models tokenize and process reasoning problems?
- Compare linguistic strategies: Do models use different frequency patterns for identical tasks?
- Identify architectural signatures: Can you distinguish model families by their spectral patterns?
- Analyze reasoning evolution: How do spectral patterns change with problem difficulty?
Publication Workflow
- Generate comparison grids using both tools with consistent dataset configurations
- Export high-resolution PNGs with embedded statistics and clear labeling
- Combine with leaderboard data for comprehensive model evaluation
- Use group filtering to create focused comparisons for specific research questions
Best Practices
Dataset Configuration
- Consistent labeling: Use clear, hierarchical labels for tasks and scenarios
- Logical groupings: Organize models by architecture, size, or training approach
- Complete coverage: Ensure all models have data for meaningful comparisons
Analysis Strategy
- Start broad: Use overview comparisons to identify interesting patterns
- Focus deep: Use task-specific analysis to investigate specific phenomena
- Cross-validate: Compare surface performance with FFT patterns for comprehensive understanding
- Statistical awareness: Pay attention to test counts and confidence intervals
Visualization Optimization
- Appropriate resolution: Use high DPI settings for publication-quality exports
- Consistent parameters: Use identical dataset configurations across comparison runs
- Clear documentation: Include analysis parameters and filtering criteria in research notes
The ReasonScape Compare tools transform individual model evaluation into systematic comparative analysis, enabling researchers to identify patterns, validate hypotheses, and advance understanding of AI reasoning capabilities across multiple dimensions of analysis.