Explorer
ReasonScape Explorer (explorer.py)
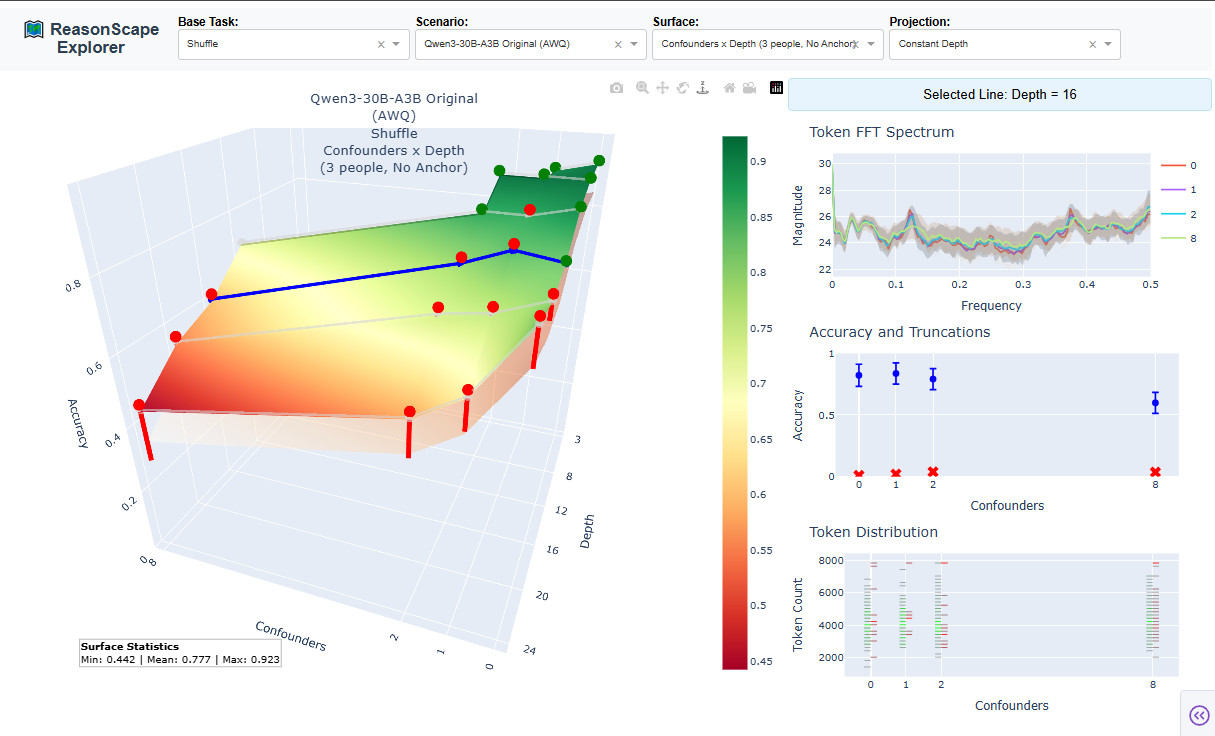
The ReasonScape Explorer is an interactive analysis platform enabling researchers to navigate multi-dimensional difficulty manifolds and examine the behavior of AI reasoning systems in depth through advanced 3D visualization and statistical analysis.
Interface Overview
The Explorer provides four key selection controls:
- Base Task: Choose the reasoning domain (Shuffle, Boolean, Objects, etc.)
- Scenario: Select specific model and configuration
- Surface: Pick difficulty parameter mapping (e.g., "Confounders × Depth")
- Projection: Select projection axis (Constant Depth, Constant Confounders, etc.)
3D Surface Visualization Components
Main Performance Surface
The central 3D visualization presents reasoning difficulty as cognitive terrain:
- X/Y axes: Task parameter dimensions (complexity, format difficulty, etc.)
- Z axis (height): Model accuracy at each parameter combination
- Color gradient: Performance quality (red = poor → yellow = moderate → green = excellent)
- Surface topology: Reveals cognitive architecture strengths and breaking points
Surface Statistics
The bottom-left corner displays key surface statistics:
- Min/Max accuracy: Performance range across the entire difficulty space
- Mean accuracy: Overall performance level
- Surface coverage: Indication of data density and sampling completeness
Statistical Confidence Elements
Lower-Bound Shadow Surface: A semi-transparent surface below the main terrain showing the 95% confidence interval lower bound, providing immediate visual feedback on statistical reliability.
Performance Indicator Spheres:
- Green spheres: "Pass" points with >90% accuracy (considering confidence margins)
- Red spheres: Problem points with >2% truncation rates
- No sphere: Normal performance points within expected ranges
Truncation Analysis Towers
Red truncation bars extend downward from the accuracy surface:
- Bar depth: Proportional to truncation rate (model hitting context/processing limits)
- Visual capping: Bars stop at the floor plane even if truncation exceeds accuracy
- Failure mode detection: Identify where models break down due to resource constraints
Interactive Grid Line Selection
Semi-transparent grid lines overlay the surface for systematic analysis:
- Projection lines: Represent parameter sweeps (constant value in one dimension, varying in the other)
- Click to select: Lines become solid blue when selected, updating all analysis panels
- Real-time sync: All statistical views update automatically to selected projection
Triple-Panel Statistical Deep Dive
The right panel provides three synchronized analysis views of the selected projection line.
The top-right panel provides a Frequency domain analysis of the reasoning problems:
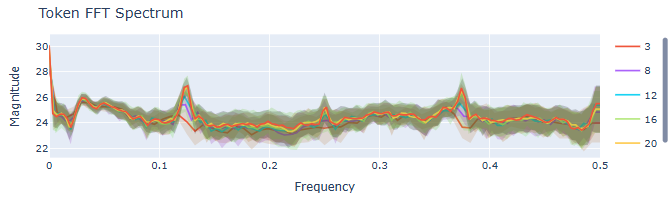
- Multiple spectral series: Each point along the selected line becomes a frequency spectrum
- Shaded confidence bands: Mean spectrum with standard deviation regions
- Tokenization signatures: Different models show distinct frequency responses to identical tasks
- Linguistic complexity: Higher frequencies often correlate with reasoning complexity
The middle-right panel provides a detailed Performance analysis across the parameter sweep:
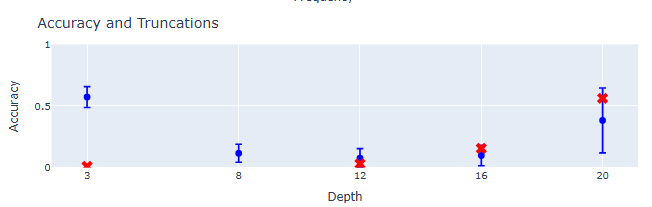
- Blue whisker plots: Mean accuracy with 95% confidence intervals
- Red truncation indicators: Showing completion failure rates
- Parameter progression: Observe how performance changes with increasing difficulty
- Breaking point identification: Pinpoint where cognitive capabilities fail
- Statistical reliability: Confidence intervals show measurement certainty
The bottom-right panel provides Completion histogram analysis revealing processing strategies:
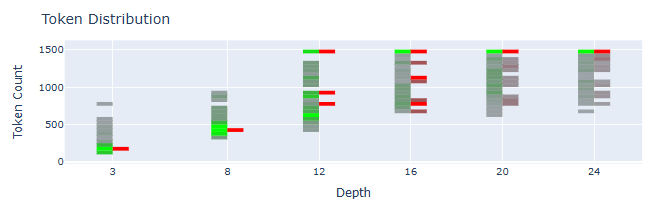
- Vertical histograms: Token count distributions for each difficulty point
- Green bars: Correct response patterns
- Red bars: Incorrect response patterns
- Color intensity: Frequency of each completion length
- Multi-modal patterns: Reveal different cognitive strategies within the same model
- Strategy evolution: Processing approaches change with difficulty
Navigation and Analysis Workflow
- Select task and scenario using the top dropdowns
- Choose surface parameters to define the difficulty dimensions
- Pick projection type for systematic analysis
- Explore the 3D surface to identify interesting regions
- Click grid lines to select parameter sweeps for detailed analysis
- Examine statistical panels for quantitative insights
- Compare multiple scenarios by switching between models
The Explorer transforms AI evaluation from static benchmark comparison to interactive cognitive archaeology, enabling researchers to excavate the information processing principles underlying artificial reasoning systems. The combination of 3D visualization, statistical confidence indicators, and multi-scale analysis tools provides unprecedented insight into how AI systems navigate complex reasoning challenges.
Future Enhancements
Point Projection Mode (planned): Individual test case examination by clicking surface points, with test case browsing and response analysis capabilities for even deeper investigation of reasoning patterns.