Leaderboard
ReasonScape Leaderboard (leaderboard.py)
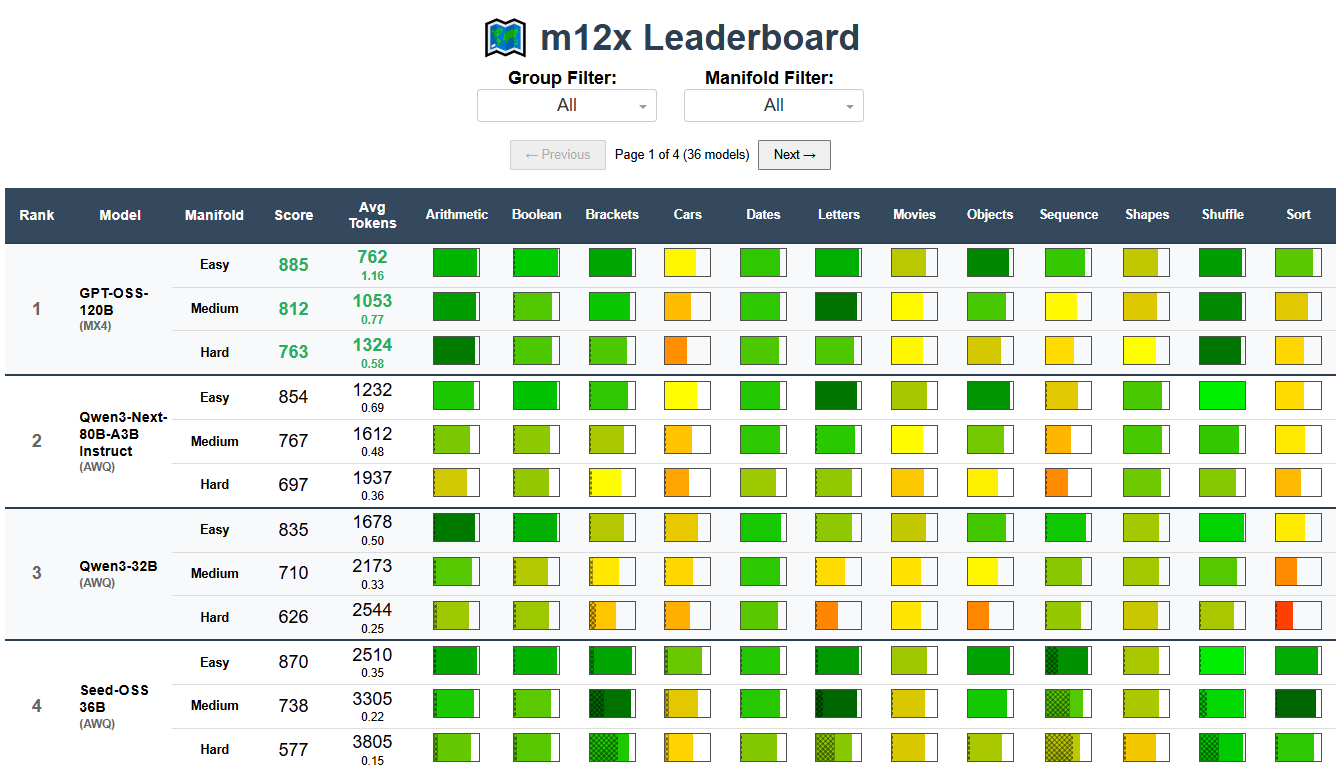
The ReasonScape Leaderboard provides a multi-domain, reasoning-aware LLM performance ranking system with heatmap visualization, pagination, and comprehensive statistical analysis.
Usage
Interactive Web Dashboard
# Launch interactive dashboard (default port 8050)
python leaderboard.py data/dataset.json

# Custom port
python leaderboard.py data/dataset.json --port 8080
Static Output Generation (CLI Mode)
For static leaderboard outputs (reports, CI/CD, or programmatic analysis), use the analyze.py scores subcommand instead:
# Generate markdown report (default format)
python analyze.py scores data/dataset.json --format markdown --output leaderboard.md

# Generate JSON output for programmatic parsing
python analyze.py scores data/dataset.json --format json --output leaderboard.json

# Generate PNG image of leaderboard table
python analyze.py scores data/dataset.json --format png --output leaderboard.png

# Filter by groups
python analyze.py scores data/dataset.json --filters '{"groups": [["family:llama"]]}' --output leaderboard.md

# Filter by specific evaluations
python analyze.py scores data/dataset.json --filters '{"eval_id": [0, 1, 2]}' --output leaderboard.md

# Combine filters
python analyze.py scores data/dataset.json \
  --filters '{"groups": [["family:llama"]], "eval_id": [0]}' \
  --output leaderboard.md
Note: The standalone CLI mode has been replaced by analyze.py scores. See analyze.md for complete documentation of the scores subcommand.
Command Line Options
config: Configuration JSON file (required positional argument)--port PORT: Custom port for web server (default: 8050)--debug: Run in debug mode
Interactive Dashboard Features
Dynamic Filtering
- Tier Filter: Show all difficulty levels or filter to specific manifolds (e.g., "Easy", "Medium", "Hard")
- Dynamic Model Filter: Filter by family, architecture and other model attributes.
Multi-Difficulty Model Display
Models display 3 rows per model showing performance across difficulty levels:
- Easy: Baseline reasoning tasks
- Medium: Intermediate complexity scenarios
- Hard: Advanced reasoning challenges
This multi-row format reveals how models scale with task difficulty and identifies failure modes across the difficulty spectrum.
Interactive Rankings with Statistical Confidence
- Models ranked by ReasonScore with per-task breakdowns and 95% confidence intervals
- Average Token Usage showing completion efficiency with score/token ratios
- Asterisks mark incomplete evaluations or insufficient statistical data
- Top scores highlighted in green per difficulty level
- Best/worst token efficiency marked in green/red respectively
Heatmap Performance Visualization
Novel color-coded heatmap cells provide at-a-glance performance understanding:
Performance Fill (Left to Right):
Cell fills from left to right based on success rate (0-100%).
Color Scale (Red → Yellow → Green):
- 🟢 Green (>0.9): Exceptional performance
- 🟡 Yellow-Green (0.7-0.9): Good performance
- 🟠 Orange-Yellow (0.5-0.7): Moderate performance
- 🔴 Red-Orange (0.3-0.5): Poor performance
- 🔴 Dark Red (<0.3): Severe failure
Truncation Overlay:
- Cross-hatch pattern overlays the performance fill from left to right
- Width represents truncation ratio (0-100%)
- Indicates context limit issues or reasoning failures
- Higher truncation = wider cross-hatch pattern
Cell Hover Tooltips:
- Manifold and task labels
- Success rate with confidence intervals
- Token usage
- Truncation ratio
This visualization enables rapid identification of:
- Task-specific strengths and weaknesses
- Context limit issues via cross-hatch patterns
- Difficulty scaling behavior
- Performance consistency across domains
Token Efficiency Analysis
- Score/Token ratios displayed beneath average token counts
- Identifies cost-performance optimal models
- Best ratio per difficulty highlighted in green
- Worst ratio per difficulty highlighted in red
- Resource utilization summaries for deployment planning
Fair Sorting Algorithm
The leaderboard uses a fair multi-pass sorting algorithm that enables models with different numbers of difficulty levels to be compared fairly:
- Models with the most complete evaluations (typically 3 difficulty levels) are sorted by overall ReasonScore
- Models with fewer difficulty levels are inserted based on comparable score calculations
- For comparison, the algorithm computes what the complete models would score using only the same difficulty subset
- This ensures models aren't penalized for having fewer evaluations while maintaining meaningful rankings
ReasonScore Calculation
ReasonScore provides a unified performance metric across all tasks and difficulty levels:
ReasonScore = 1000 × Geometric_Mean([
  adjusted_center + adjusted_margin - truncated_ratio
])
Where:
- adjusted_center: Knowledge-adjusted accuracy (performance above random guessing)
- adjusted_margin: 95% confidence interval half-width (statistical reliability bonus)
- truncated_ratio: Fraction of responses hitting context limits (reliability penalty)
This metric rewards:
- High accuracy across reasoning domains
- Statistical confidence with sufficient data
- Completion reliability without truncation failures
- Consistency: Geometric mean penalizes outliers and weak performance in any domain
The 1000× scaling produces intuitive scores (200-900+ range) rather than decimals.
Understanding ReasonScore
- 900+: Saturation at this difficulty level (exceptional reasoning across all domains)
- 700-900: Excellent performance with minor failure modes
- 500-700: Good reasoning with notable truncation or difficulty scaling issues
- 300-500: Limited reasoning capability
- <300: Severe reasoning deficits across most domains
Deployment Considerations
Standalone Server
python leaderboard.py dataset.json --port 8050
# Access at http://localhost:8050
Reverse Proxy Deployment
python leaderboard.py dataset.json --url-base-pathname /leaderboard/
# Configure nginx/apache to proxy /leaderboard/ to the app
Mobile Responsiveness
The leaderboard includes mobile viewport configuration with: - Initial scale: 0.4 (zoomed out for table visibility) - Minimum scale: 0.2 (allows further zoom out) - User scalable: yes (pinch to zoom enabled)